Technical Brief: Understanding Phase-Measurement Accuracy in Confined-Access 3D Metrology
By Sugia Engineering Team
Why Phase Measurement Matters for NDT
Quantitative defect characterization — measuring the depth, area, and volume of a corrosion pit or crack — separates an inspection tool from a measurement instrument. For fitness-for-service (FFS) assessments performed under API 579-1 or ASME BPV Code Section V, Article 9, measurement accuracy directly determines whether a component is cleared for continued service, de-rated, or removed.
Traditional stereo videoscopes measure depth by triangulating between two offset optical paths with a known inter-pupillary baseline. This approach works well at a single user-selected point but provides sparse data: typically one depth measurement per operator click. Structured-light phase-measurement profilometry, as implemented in the OmniScope F1, projects a sequence of precisely phase-shifted fringe patterns from a digital micro-mirror device (DMD) projector integrated into the probe tip. A dense depth map is computed from the per-pixel phase differences across the projected pattern sequence, yielding up to 1.2 million 3D measurement points per frame — matched to the sensor’s 1440 × 1080 pixel grid.
This technical brief examines the factors governing phase-measurement accuracy in the confined, curved, and often low-reflectivity geometries accessible to an industrial borescope.
Working-Distance Effects
Phase-measurement accuracy degrades predictably with increasing working distance. The OmniScope F1 achieves a Z (depth) resolution of ±0.01 mm at a 15 mm working distance. At 30 mm, the resolution widens to ±0.025 mm, and at the maximum rated 60 mm measurement distance, it reaches ±0.06 mm. This follows a roughly quadratic relationship governed by the angular sensitivity of the DMD projector’s pixel pitch convolved with the sensor’s modulation transfer function (MTF).
Practical guidance: For critical FFS measurements (e.g., determining whether a corrosion pit exceeds 80% of the corrosion allowance), position the probe tip as close as physically practicable to the target surface. The F1’s 8 mm minimum working distance allows very close approach in most borescope-port geometries.
Surface Reflectivity and the Lambertian Assumption
Phase measurement assumes that the target surface reflects the projected fringe pattern diffusely — that is, the surface behaves approximately as a Lambertian reflector. In practice, many NDT inspection surfaces violate this assumption:
- Polished metallic surfaces (turbine blade roots, bearing journals): specular reflections saturate the sensor, producing data dropout in the affected pixels.
- Dark, heavily oxidized surfaces (boiler tube internal scales, cast-iron water pipe interiors): low reflectivity reduces the signal-to-noise ratio of the detected fringe pattern, increasing Z uncertainty.
- Translucent coatings (some ceramic thermal-barrier coatings): subsurface scattering broadens the apparent fringe width, introducing a positive Z bias.
The F1 compensates through multi-exposure HDR fringe capture — the DMD projector cycles through three fringe intensities, and the console’s GPU fuses the resulting depth maps, selecting the best-exposed pixel at each (x, y) coordinate. This typically recovers 85–92% of pixels on challenging surfaces compared to 55–70% for single-exposure fringe capture.
NIST-Traceable Calibration and Field Verification
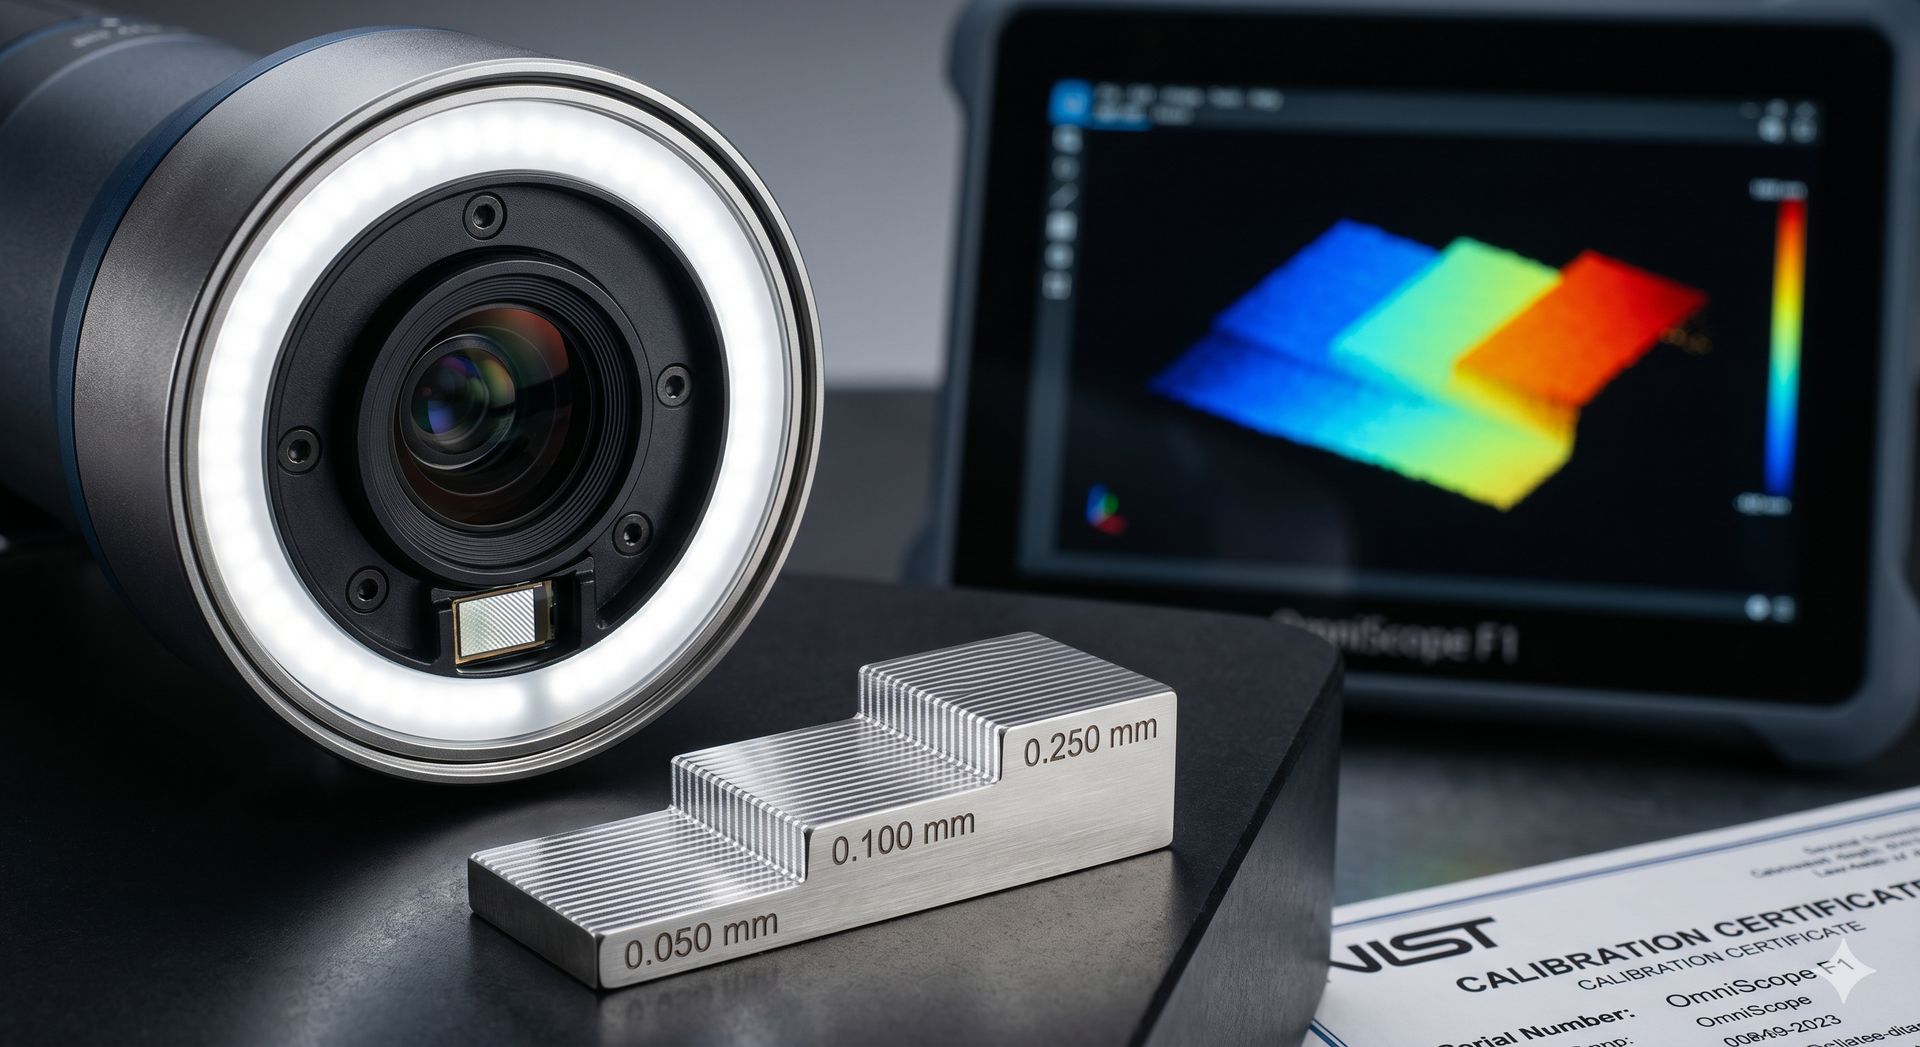
Factory calibration uses five NIST-traceable reference artifacts with known step heights (0.050 mm, 0.100 mm, 0.250 mm, 0.500 mm, and 1.000 mm), each measured at the five calibrated working distances. The resulting calibration table maps each (row, column, working distance) tuple in the sensor grid to a Z-correction factor, stored in the probe module’s EEPROM.
A field-verification artifact — a stainless-steel coupon with three laser-etched steps of known depth, supplied with each F1 system — enables a 30-second accuracy check at the start of each inspection shift. The operator positions the probe at the calibrated 15 mm working distance, captures a measurement of the verification artifact, and compares the measured step depths to the certificate values. A deviation exceeding the specified ±2% tolerance triggers a recalibration workflow.
Recommendations for ASME-Compliant Measurement
- Always perform the field-verification check at the start of each inspection shift and document the result in the inspection report.
- For measurements used in FFS Level 3 assessments, capture each defect from at least two different probe angles and average the results to reduce orientation-dependent bias.
- When measuring on specular surfaces, apply a thin, removable matting spray (e.g., Magnaflux SKD-S2 developer) to create a diffuse surface — and document the coating thickness correction in the measurement report.
- Export the raw point cloud (PLY format) alongside the measurement report for independent third-party verification if required by the applicable engineering standard.
Focus Keywords
Target Markets